MTD Net Revenue
$0
April 2026 (month to date)
Monthly Recurring Revenue
$0
279 active subscribers
Warm Conversion Leads
0
Active drop-in repeat customers — View Conversion →
Monthly Revenue
Revenue Mix
Daily Revenue
Revenue by Tier — Month-over-Month
| Tier |
|---|
* May 2026 is partial (month in progress)
Demographics
Customer location and profile breakdown — 525 customers with address data (Kenko + Stripe billing)
Loading map…
Top Cities
Age Distribution
How They Found Us
Customer Density by Postal Area (FSA)
| Postal Area | City | Customers | Avg Age | Top Channel |
|---|
Reference guide for how each product maps to a revenue tier.
Revenue Tier Breakdown
Credit Packs
Intro
- Pink, Introduce me!
- Pink, Let's Get Close
Credit Packs
- Pink, Just curious
- Pink, I'm ready / I'm Ready
- Pink, Ready For It
- Pink, Let's Go
- Pink, Let's Stay Close
Shareables
- Now Exclusive
- Absolutely Devoted
- Fully Committed
Memberships
Value No Commit
- Pink, I Like (no commit)
- Pink, I Fancy (no commit)
- Pink, I Love (no commit)
Value 3-Commit
- Pink, I Like (3-month / Min 3 mo)
- Pink, I Fancy (3-month / Min 3 mo)
- Pink, I Love (3-month / Min 3 mo)
Obsessed
- Pink, I'm Obsessed
- Founding Membership
Other
Events
- Puppy Pilates
- Galentine's
- Valentine's
- Halloween
- Other events
Retail
- Grip Socks
- Flower Clips
- Gift Cards
- Other merchandise
Credit Packs vs Memberships
Membership Revenue Growth
Non-Membership Revenue Mix
Refunds & Net Revenue
ACTIVE MEMBERS
577
Kenko source of truth
Active
PAUSED
26
on hold
Paused
STRIPE SUBSCRIBERS
329
commitment + no-commit plans
Recurring
MRR
$54,578/mo
monthly recurring revenue
Revenue
Active Subscriptions
329Top Subscription Plans
Membership Status · Kenko
Retail
Events
Upcoming Renewals
RECENT PURCHASERS (60-DAY)
701
Unique buyers in last 60 days
Conversion Window Analysis
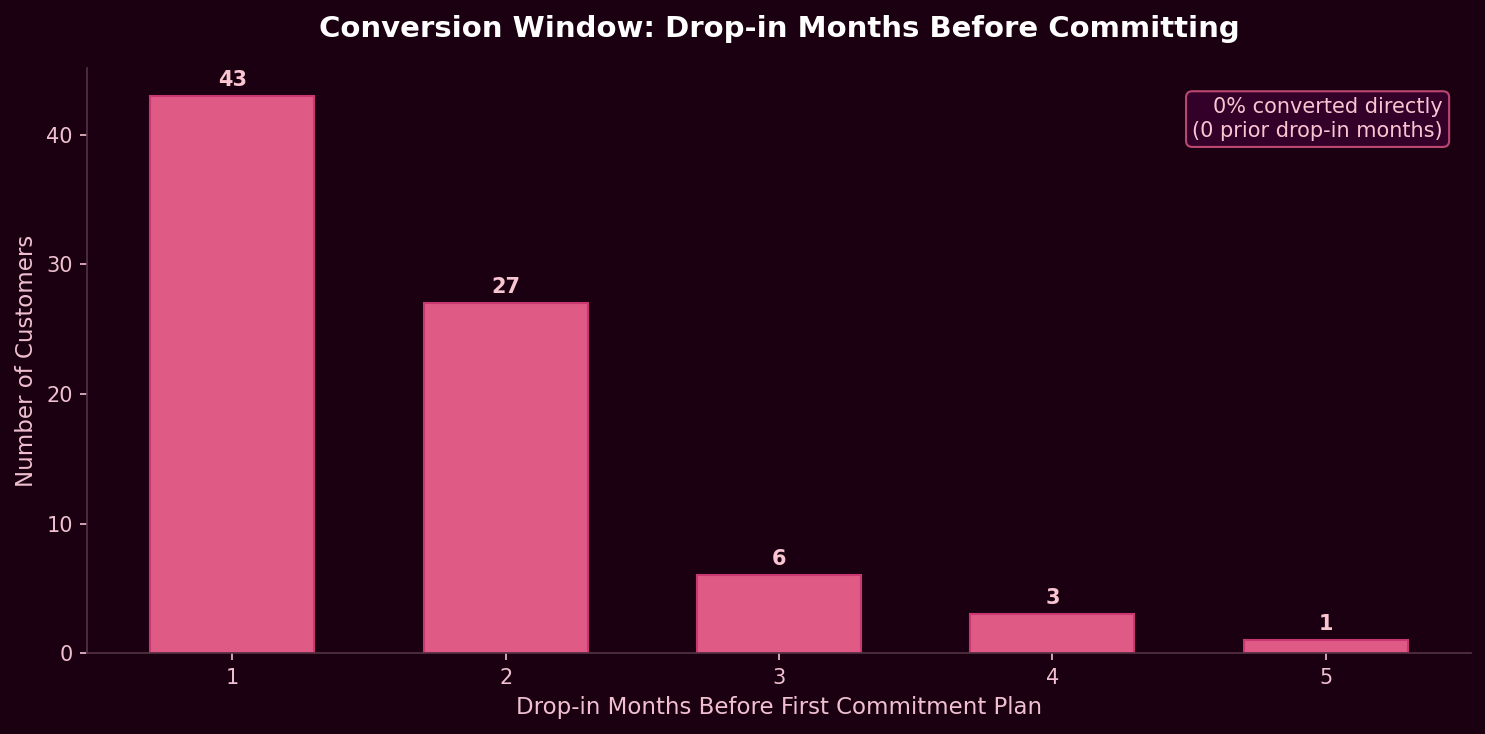
Key insight: A significant portion of commitment customers converted directly with no prior drop-in. Of those who did trial drop-in first, most converted after 1–2 months. See tile numbers above for current active and retention counts.
Recent Transactions
| Date | Customer | Product | Qty | Amount |
|---|
Run a quick analysis export using your full 5,147-transaction dataset.
PiP AI Insights